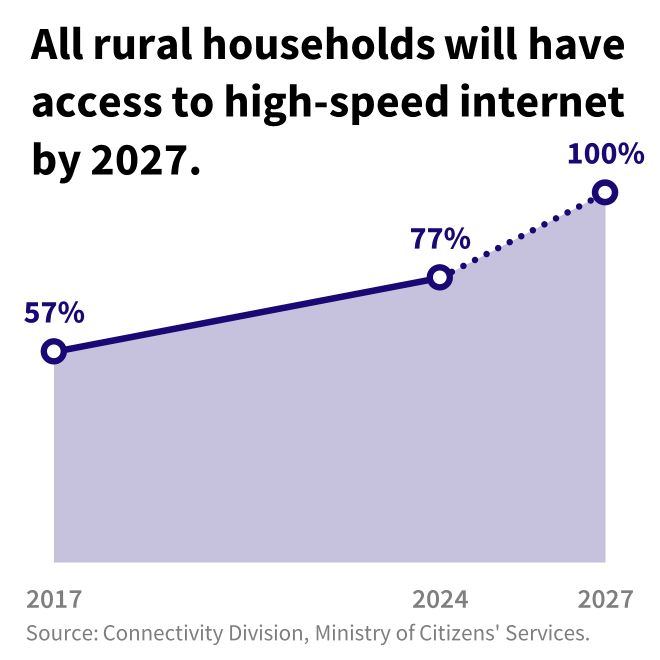
I produced this area chart for a Makeover Monday post where I redesigned a pie chart published on the Government of British Columbia’s Instagram page. The pie chart was confusing to say the least – they were attempting to show change over time, and it wasn’t working.
This area chart is heavily oriented toward social media, making use of very large text and thick lines to ensure it can be read and understood quickly on a small screen. I rushed this out as a “here’s how to do this better” concept without paying much attention to polish or branding – this was just about focusing the message of the visualization.

